Contents
How to check CPU & Mem status of micro-services in CloudOne - V 1
Application detail dashboard
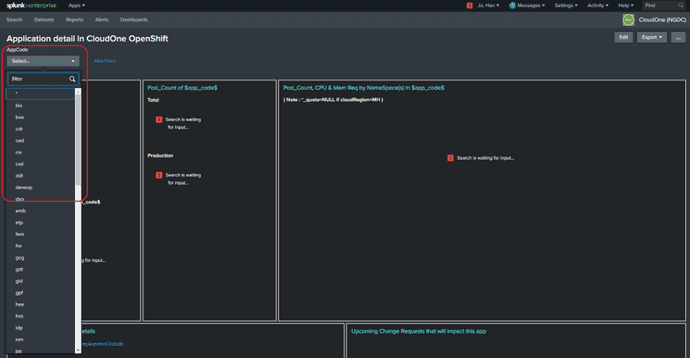
- Go to https://splunk.corp.netapp.com/en-US/app/ngdc/details_of_an_application_in_cloudone
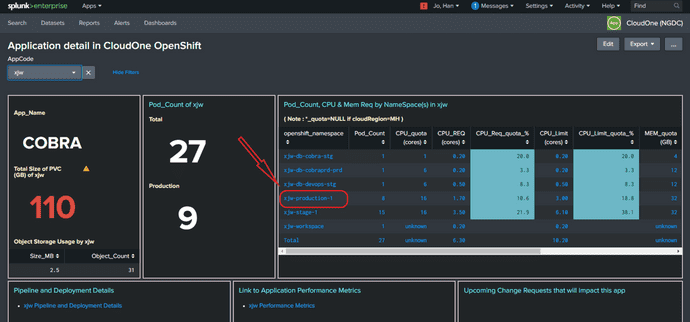
- Click the ‘AppCode’ dropdown list, and choose the 3-letter-code of your application
- Click on a NameSpace from the table (a new tab will pop up for ‘NameSpace detail by Application in CloudOne’ dashboard)
- On the ‘NameSpace detail by Application in CloudOne’ dashboard, you can set the Time Range for the data you are interested in.
Default = ‘last 7 days’, Please don’t go over ‘last 30 days’
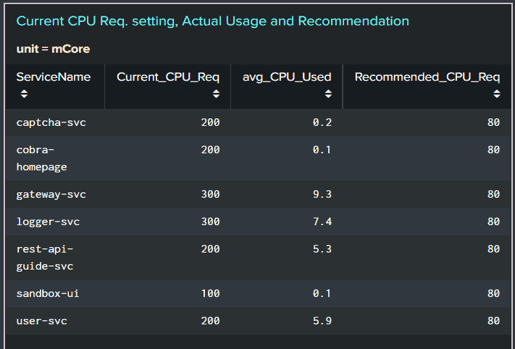
- Scroll down to the panel named ‘Current CPU Req. setting, Actual Usage and Recommendation’. This panel shows CPUReq values currently set in each service’s deployment config, actual CPU usage (avg over the Time Range chosen earlier), and recommended CPUReq value to be set to for each service/deployment.
- Scroll down to the panel named ‘Pod and Container stats in
’ to see the metrics of each Pod in the NameSpace. avgCPUmCore = average CPU usage in mili-Core by the pod, and maxCPUmCore = usage spike in the Time Range chosen earlier
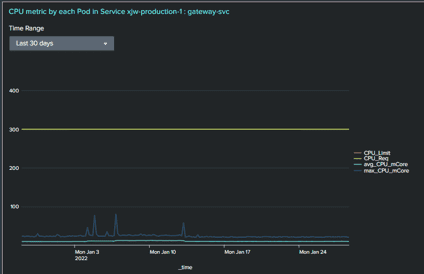
- Scroll further down to the panel named ‘CPU metric by each Pod in the NameSpace … ‘ to see CPU usage trend by each pod.
- If you want to see the metrics of a specific Service (Deployment / StatefulSet), scroll back up to the panel named ‘Pod and Container stats in
’, and click on a ServiceName.
-
Another dashboard named ‘Service detail by NameSpace in CloudOne’ will pop up in a new tab. Scroll down to the panel named ‘Pod and Container stats in
: ’,


