CloudOne: Navigating the OpenShift Web Console - V 3.6
Navigating the OpenShift Web Console
In order to troubleshoot a deployment, sometimes it is necessary to navigate to the OpenShift Web Console to gather information about a deployment and troubleshoot. Using a Workspace as an example,
the OpenShift web console will be found at the URL :
<https://k8s-east1-console.ncloud.netapp.com/console/project/XXX-workspace
where XXX is the unique (usually) 3-letter appCode for the application. This and the other
OpenShift web console URLs (for the other Hostspaces) can be found in the
ServiceNow CMDB and are also referenced with Azure DevOps for the given application environment.
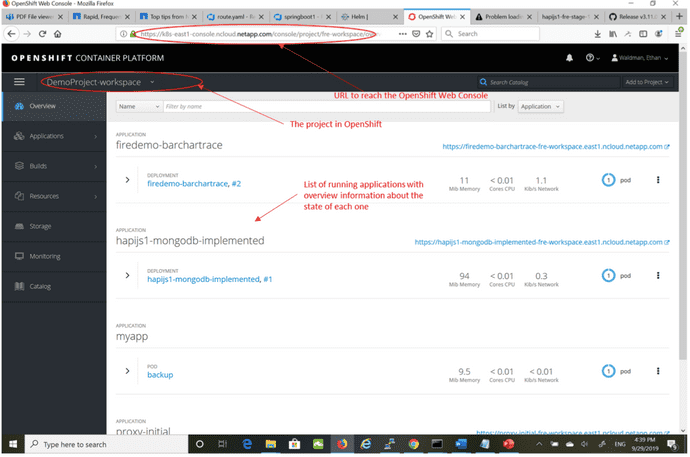
In order to examine the state of an application in OpenShift, navigate to a running pod (usually one container in a pod) as follows:
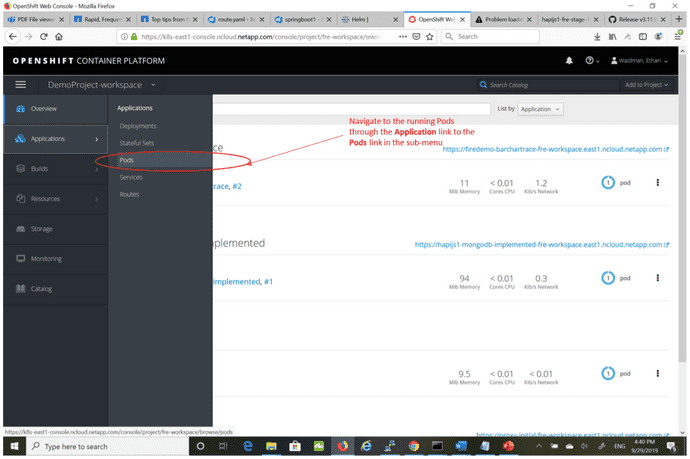
- In the left pane of the web console, hover over or click the Application link and
select Pods
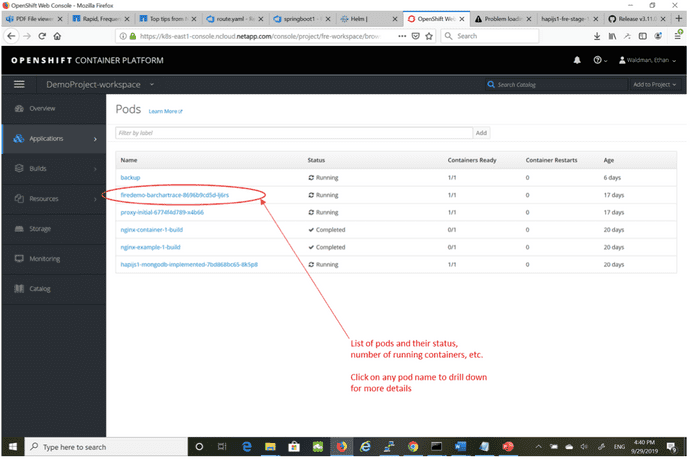
- Identify the pod running the application (should be apparent by the name) and confirm its current state based on the “Status” column
- Click the name of the Pod to see more details
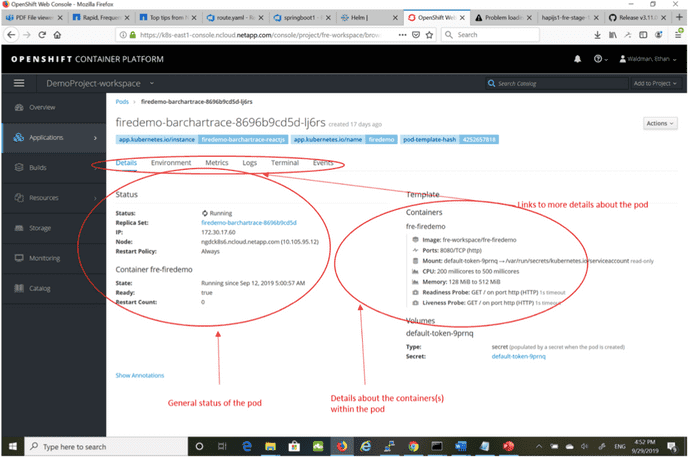
- In order to examine the log output from the application, click the Logs
link along the top of the middle pane
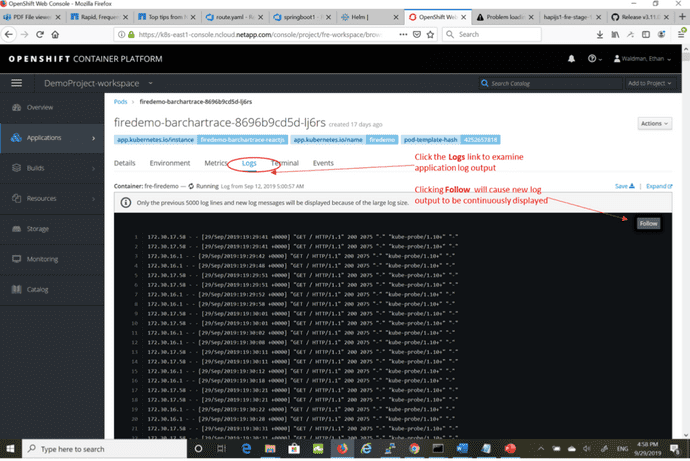
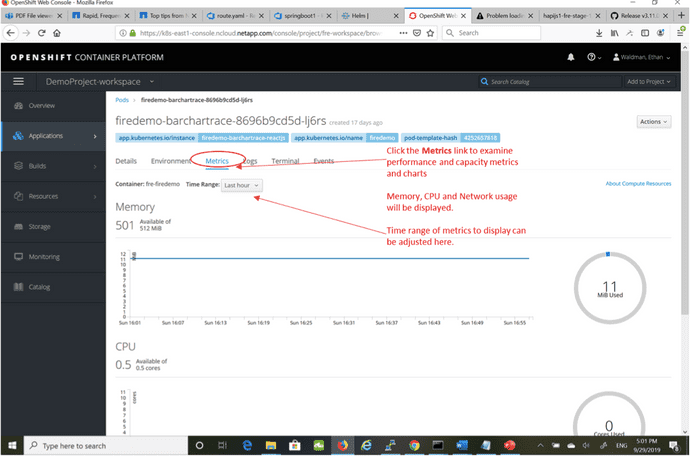
- In the case of performance (or suspected performance) issues, click the
Metrics link to examine CPU, memory or network usage for any anomalous
behavior
- If the application is dependent on environment variables and these values need to be confirmed, click on the Environment link
- To see if the application has been consistently healthy or has been crashing, failing to start or otherwise exhibiting unhealthy behavior, click on the Events link to see health problems detected by OpenShift in monitoring the application
- Additional details about the deployment of the container can be found under the Details link
- Additional, more in-depth exploration from within the container can be done by clicking the Terminal link, which will open an interactive shell running within the live container that runs the application
In addition to examining containers in pods, some other deployment issues,
particularly related to connectivity to the deployed application, can be
examined by looking at Services and Routes for the application:
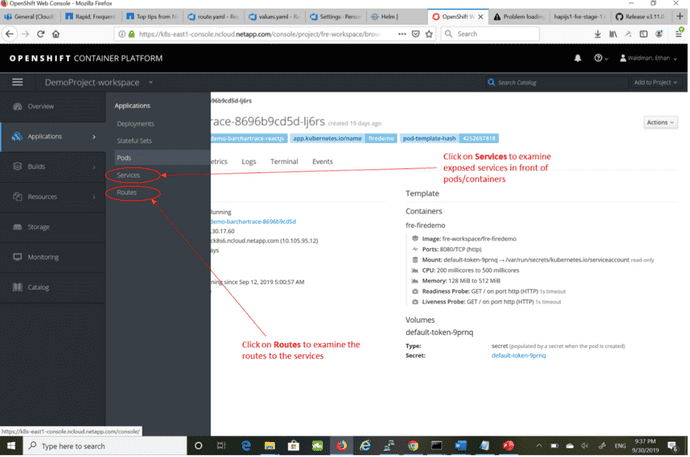
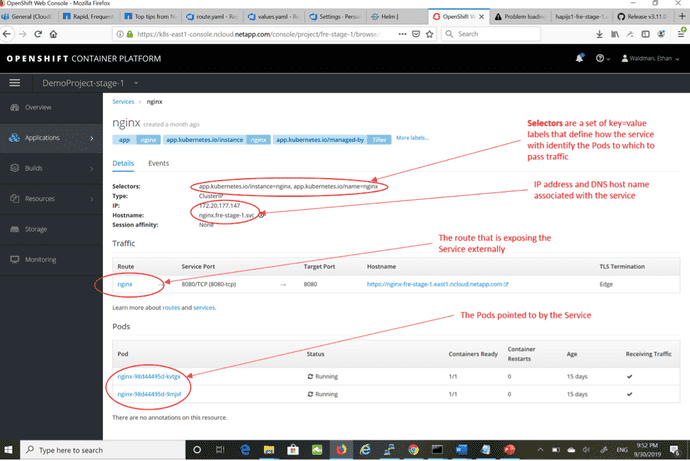
- To navigate to the Service definitions and states, hover over or click the
Application link and select Services, then click on the appropriate
service name, which will be based on the application stack name, to examine
its details
- To navigate to the Route definitions and states, hover over or click the
Application link and select Routes, then click on the appropriate
route name, which will be based on the application stack name, to examine
its details
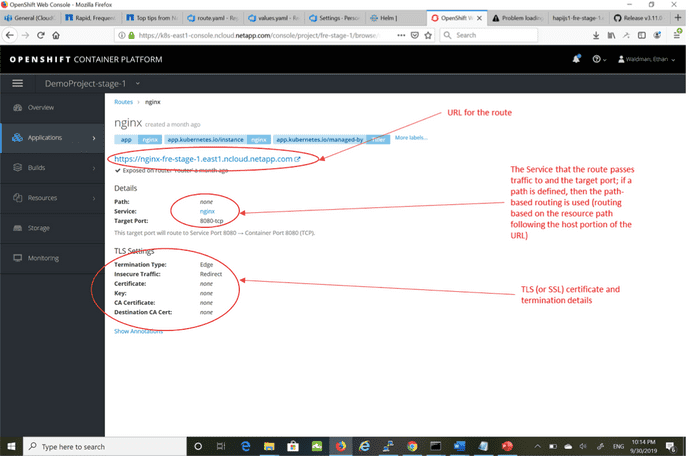 The combination of routes and services provide connectivity from outside the
OpenShift cluster to the specific application running within. If the application
appears to not be reachable, tracing from the outside inward via these screens
and details may provide the necessary information for troubleshooting.
